Asset Management
Complete visibility of all your IT assets on one dashboard
Discover and manage every single device, software, and hidden asset on your network with our new asset management integration, powered by Lansweeper.
Enhance your TeamViewer experience, know more about your devices, and proactively keep your IT infrastructure healthy, stable, and secure. Boost your IT efficiency and centrally manage, monitor, track, patch, and protect your computers, devices, and software — all from a single platform with TeamViewer Remote Management.


Discover and manage every single device, software, and hidden asset on your network with our new asset management integration, powered by Lansweeper.

TeamViewer Mobile Device Management ensures that your IT department can manage and secure an ever-growing device fleet 24/7 in a single console with easy onboarding, roll-out, management, and troubleshooting of mobile devices for companies that have a remote workforce.

Proactively monitor your Windows, macOS, and Linux devices — remote device monitoring provides early recognition of problems in your IT infrastructure and warns you immediately when an issue arises.
Stay one step ahead and prevent costly downtime and data loss.

Outdated, vulnerable software can put any organization at risk of cyber-attacks. Keep your IT systems up-to-date and safe by automatically evaluating, testing, and applying OS and third-party application patches with TeamViewer Remote Support.

Be on the safe side with hassle-free and policy-driven endpoint data protection. Store files and folders in the cloud under the highest security standards and have peace of mind knowing your data is stored safely and — in case of disaster — can be restored remotely from anywhere and at any time.

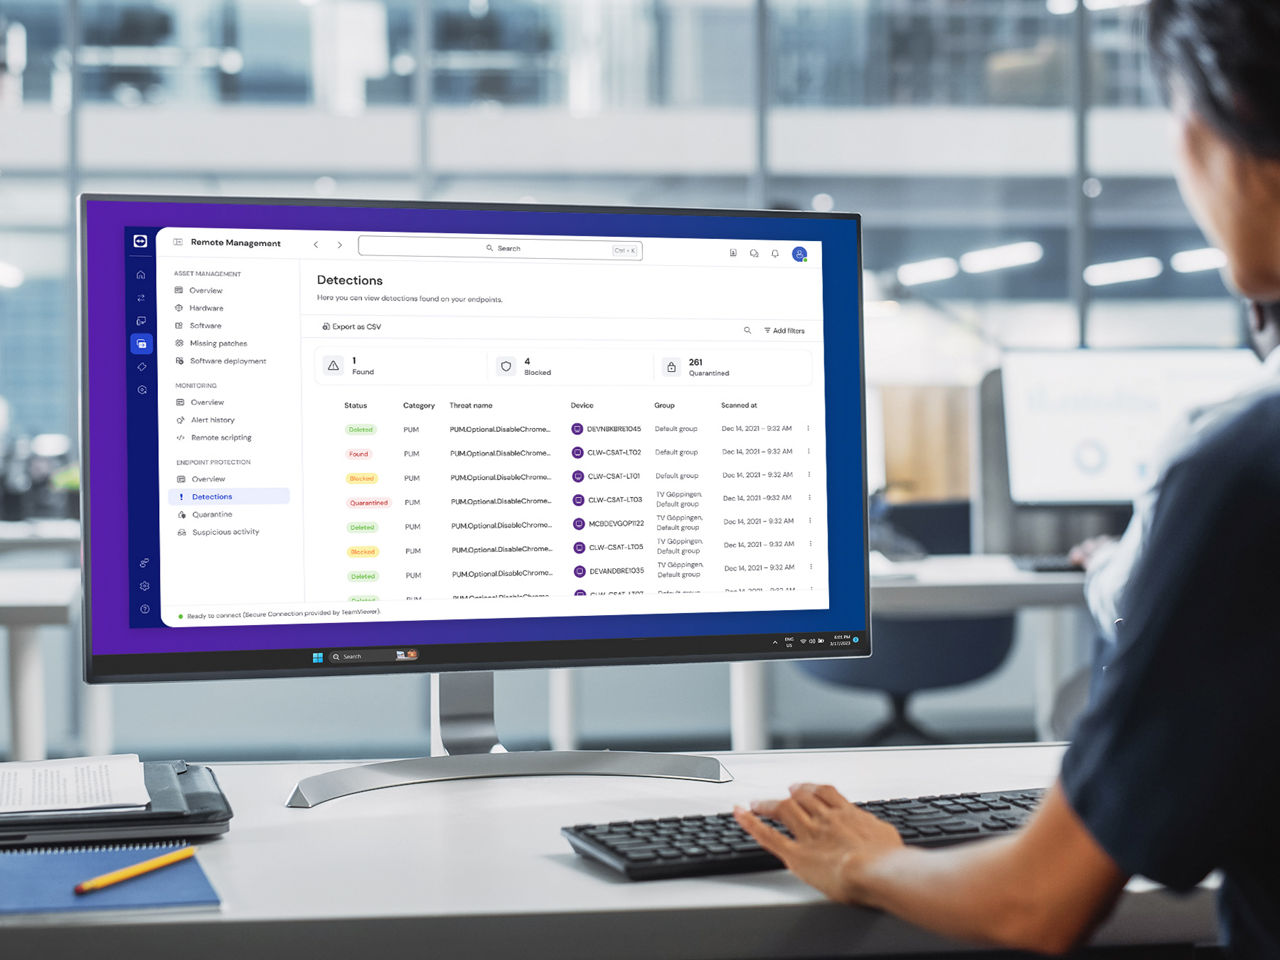
Protect your devices against malware, malicious websites and zero-day threats with ThreatDown (powered by Malwarebytes) Endpoint Protection and ThreatDown Endpoint Detection and Response — fully integrated into TeamViewer.
Get next-gen cyber security that not only searches for known signatures of known threats, but uses machine-learning and AI to detect, isolate, and remediate zero-day attacks unknown to the respective software vendor and traditional endpoint protection solutions.
Spotlight